If you have been using Google Tag Manager for a while and recently clicked the Preview button expecting the familiar iframe at the bottom of your page, you might have noticed something strange. It looks different now. Don’t worry — your container isn’t broken, and the debugging workflow hasn’t been ruined. It’s just that the debugging engine has changed.
Tag Assistant replaced the old Preview Mode back in October 2020, and it’s now the only way to test GTM containers. More importantly, it’s also the tool you need to debug Google Analytics 4. If you’ve been trying to test GA4 events and the old Preview Mode wasn’t giving you what you needed, you’ve come to the right place.
Let’s get into it.
What Is Tag Assistant
Tag Assistant is Google’s official debugging tool for GTM,GA4 and other Google tags.
Whenever you click Preview inside GTM, you’re actually launching a Tag Assistant session, Tag Assistant opens a dedicated debugging interface at tagassistant.google.com. it records everything that happens during your test session, including:tags fired, data layer messages, API calls, you name it.
Preview Mode vs Tag Assistant: What Changed
Back in the old days, clicking Preview in GTM would open your page with a gray bar at the bottom showing which tags fired. Simple, straightforward, but limited. And it relied on third-party cookies at googletagmanager.com to manage the debugging session, which (surprise) caused problems in privacy-focused browsers.
Here’s the catch: Preview Mode couldn’t handle Google Analytics 4 at all. When GA4 came around, Google needed a new debugging approach. That’s where Tag Assistant saves the day.
Here’s a quick comparison of the key differences:
| Preview Mode (Old) | Tag Assistant (New) | |
|---|---|---|
| Where results appear | In an iframe at the bottom of the test page | On a separate page at tagassistant.google.com |
| Session storage | Third-party cookie (googletagmanager.com) |
First-party cookie + LocalStorage (creates __TAG_ASSISTANT) |
| GA4 support | Not supported | Fully supported |
| Multi-page recording | Limited | Keeps recording across page loads |
| API Call visibility | Not available | Shows API calls |
| GTM authorization needed | Required for anyone testing | No — use Share Preview instead |
| Server-side GTM debugging | Not supported | Supported |
Advantages of Tag Assistant
I’ve been using Tag Assistant since it was released, and here’s why I think it’s a meaningful upgrade:
- #1. GA4 debugging: This is the big one. Tag Assistant was built (or at least heavily updated) specifically to support Google Analytics 4 testing. If you’re working with GA4 — and at this point, who isn’t — Tag Assistant is essential.
- #2. Persistent recording across pages: Tag Assistant records everything on a single page at tagassistant.google.com. As long as you don’t close that page, the test results accumulate. You can navigate through your site, trigger multiple events, submit forms, click buttons — and all the data stays in one place.
- #3. Debug without granting GTM access: Preview Mode required you to give someone access to your GTM container before they could test. With Tag Assistant‘s Share Preview, you can generate a link and send it to anyone. No GTM access needed.
- #4. More detailed information: Tag Assistant shows you not just tags and variables, but also API calls. This is incredibly useful when debugging GA4 because you can see exactly which API methods were called and what data was sent.
- #5. Server-side GTM debugging: If you’re running server-side tagging (which more and more people are), you need Tag Assistant. The old Preview Mode doesn’t help there.
Understanding the Tag Assistant Interface
The Tag Assistant page gives you several key pieces of information:
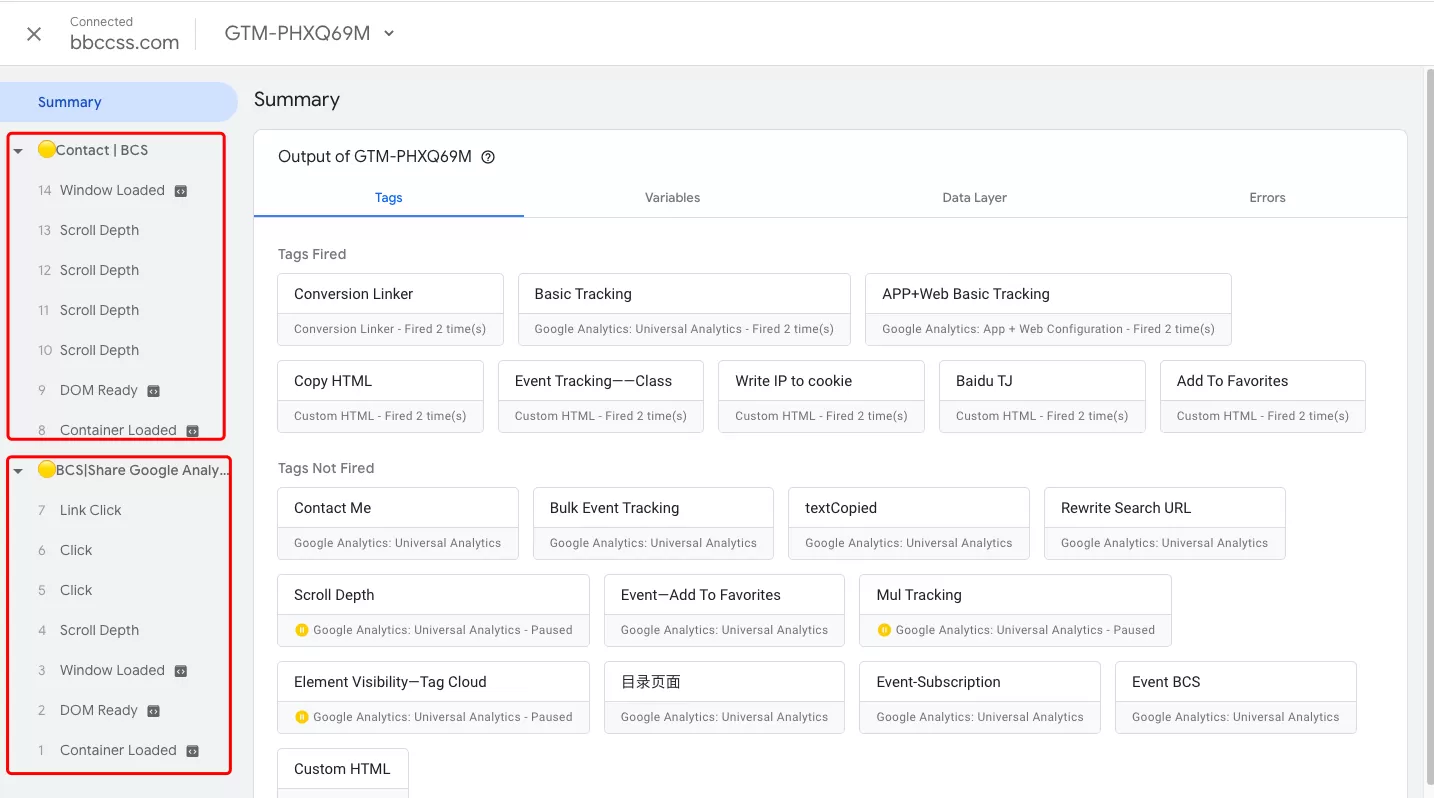
- Connected in the upper left — confirms the session is active
- GTM-XXXXXX (or G-XXXXXXX) — shows which container or measurement ID is being debugged
- Summary — lists the behaviors being tracked (page views, clicks, etc.)
- Output of GTM- — shows the specific tags, data layer messages, or errors triggered
Different icons in the Summary have different functions:
- A black triangle/arrow on the left for each page view
- A red box grouping the behaviors within that page view
- Colored indicators next to each tag (this is really useful):
- 🟢 Green — Valid tag found (the number shows how many)
- 🟡 Yellow — Tag found with minor implementation issues
- 🔴 Red — Tag found with critical implementation issues
- 🔵 Blue — Suggestions on improving overall tagging health
- ⬜ Grey with X — No tag found on the page
How to Use Tag Assistant for Debugging
This section walks you through the entire debugging workflow, from opening a session to checking GA4 event data.
Step 1: Open a Debugging Session
There are two entrances to start a debugging session:
- Click Preview in the upper right corner of your GTM workspace
- Click Preview under the Versions tab
Both will do the same thing — open a new page at https://tagassistant.google.com/.
Step 2: Configure and Start the Test
Once Tag Assistant opens, you’ll see a simple interface asking for a URL to test:
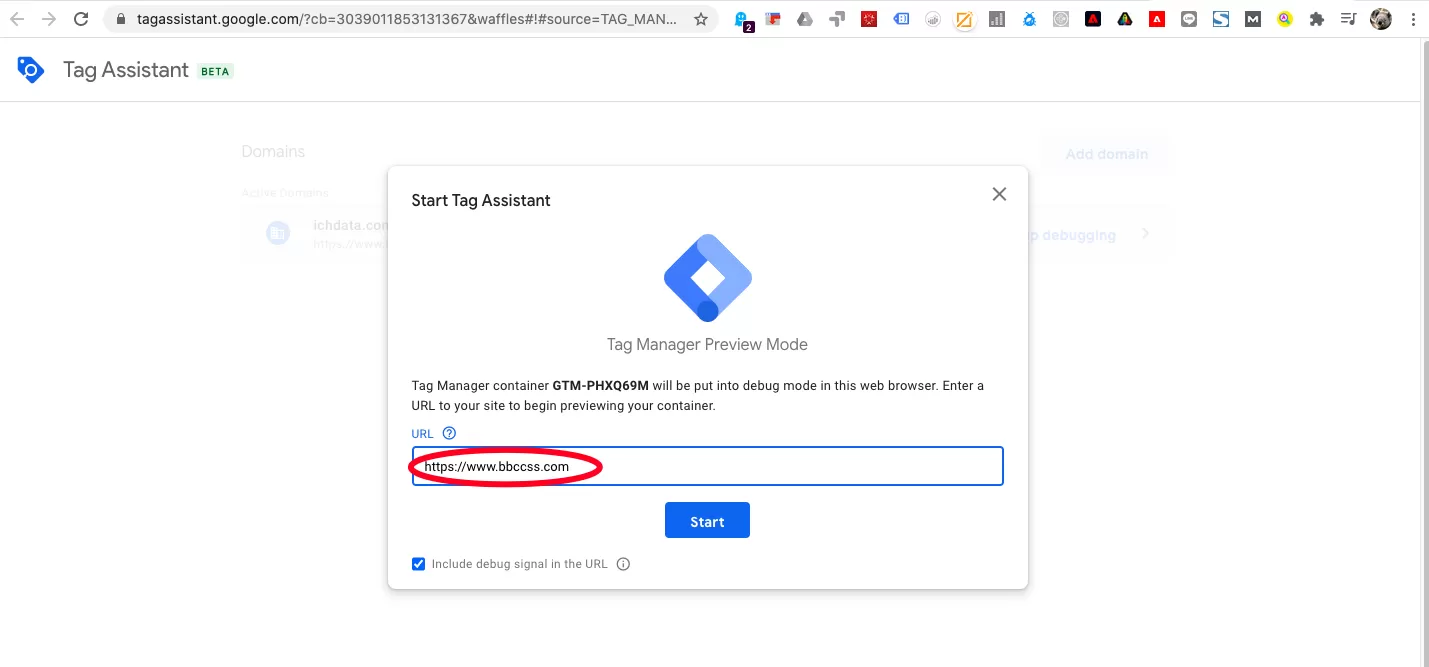
Enter the URL you want to debug (for example, https://www.yourwebsite.com) and click Start to start:
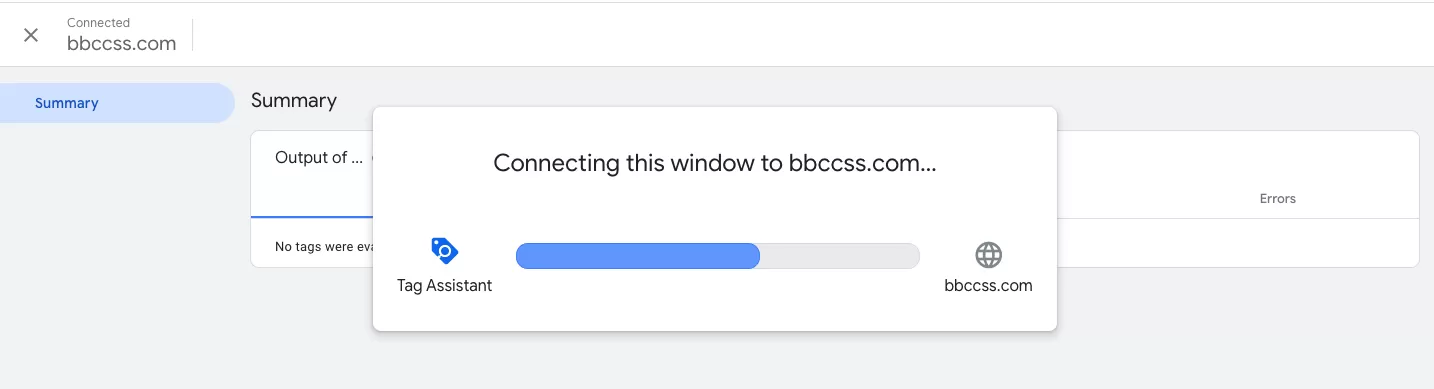
Tag Assistant will connect to that page and open it in a new tab.
Step 3: Verify the Debugging Session is Active
Once the test page opens, you’ll have two browser tabs: the Tag Assistant dashboard and the page you’re debugging.
Here’s how to confirm the test session is active:
- Check the URL — the page you’re debugging will have `?gtm_debug=x` appended to the URL (e.g., `https://www.yourwebsite.com?gtm_debug=x`)
- Look for the Debugger connected window — a small floating window in the bottom right corner of the test page confirms the connection is live
- Check the Tag Assistant page — the word Connected in the upper left corner means Tag Assistant is actively recording data
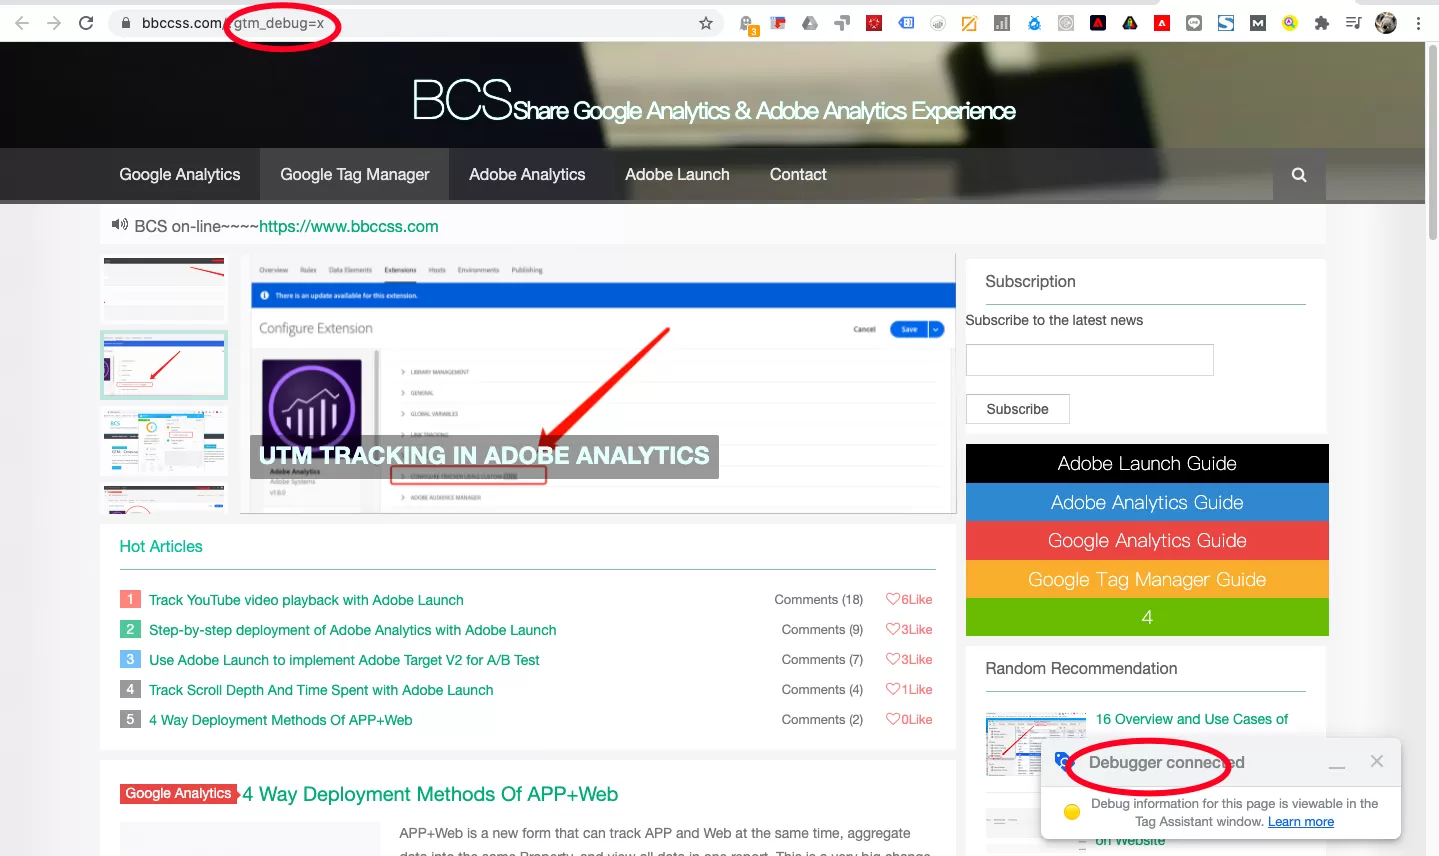
Once you see all three indicators, you’re in the test state. Anything you do on the test page — clicks, form submissions, page navigations — will be recorded by the Tag Assistant dashboard.
Step 4: Choosing What to Debug
Here’s an important detail that often confuses people. In the upper right corner of the Tag Assistant page: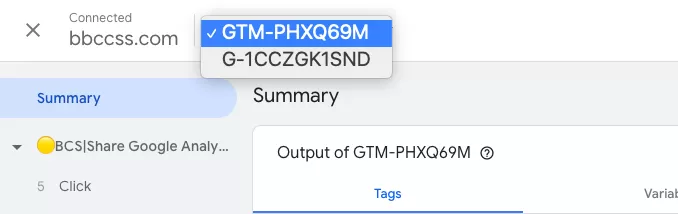
You can select which container or measurement ID to test:
- If you select something starting with GTM-, you’re debugging a GTM container
- If you select something starting with G-, you’re debugging Google Analytics 4 directly
The default setting here is GTM, which does not need to be modified.
Step 5: Debugging GTM Containers
When debugging a GTM container, the Tag Assistant interface shows:
The testing workflow is:
- Select a behavior on the left (e.g., Container Loaded, Click, DOM Ready)
- Check which tags fired on the right
- Inspect the variables to see if values were captured correctly
- Check the data layer messages for the data that was pushed
- Look at any Errors listed to catch implementation issues
Share Preview: Debug Without Granting Access
One of the most useful features of Tag Assistant is Share Preview. If you need an external expert (or a colleague who doesn’t have GTM access) to help with debugging, you don’t need to add them as a user to your container.
Here’s how:
- Go to the Versions tab in your GTM container
- Click Share Preview
- A settings window will pop up where you set the Destination URL (the page to be tested)
- Copy the generated link and share it
Whoever clicks that link will enter a debugging session for your container — no GTM authorization required.
Stop Preview
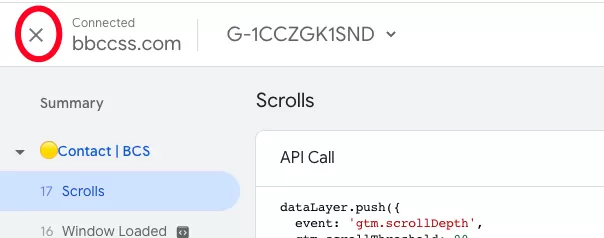
When you’re done debugging, close the Tag Assistant page by clicking the X in the upper right corner.
Final Words
If you’re working with Google Tag Manager (and especially Google Analytics 4), Tag Assistant is one of those tools you’ll use constantly once you get comfortable with it. The switch from the old iframe-based Preview Mode can be disorienting at first, but the extra information you get — API calls, GA4 event details, server-side debugging, Share Preview — makes it worth the adjustment.